
Note
Click here to download the full example code
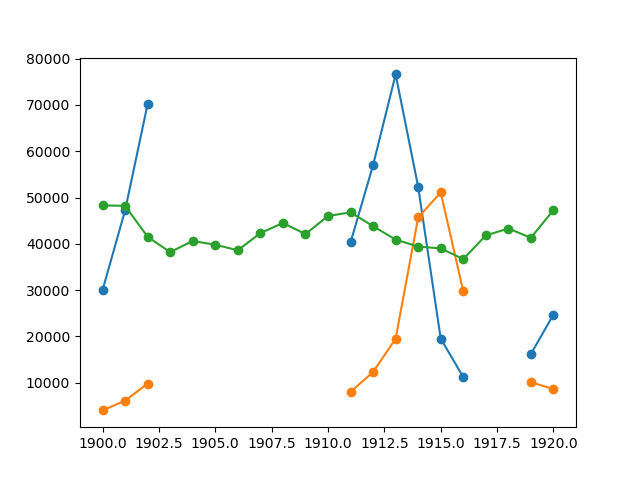
Example: Masked statistics
Plot a masked statistics
import numpy as np
import matplotlib.pyplot as plt

data = np.loadtxt('../../../../data/populations.txt')
populations = np.ma.masked_array(data[:,1:])
year = data[:, 0]

bad_years = (((year >= 1903) & (year <= 1910))
            | ((year >= 1917) & (year <= 1918)))
populations[bad_years, 0] = np.ma.masked
populations[bad_years, 1] = np.ma.masked

plt.plot(year, populations, 'o-')
plt.show()
Total running time of the script: ( 0 minutes 0.016 seconds)