
Note
Click here to download the full example code
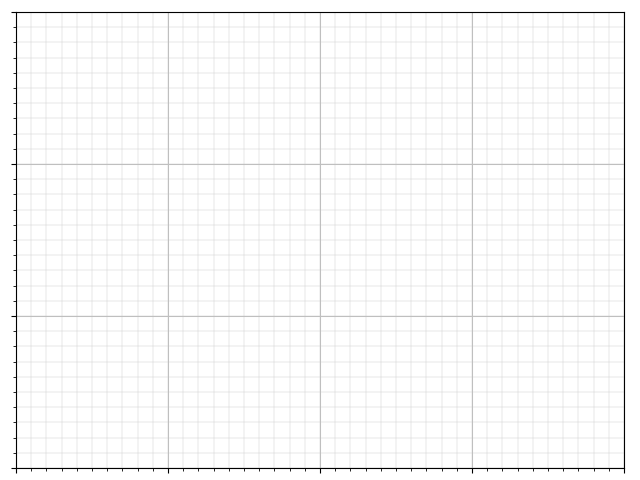
Grid
Displaying a grid on the axes in matploblib.
import matplotlib.pyplot as plt

ax = plt.axes([0.025, 0.025, 0.95, 0.95])

ax.set_xlim(0,4)
ax.set_ylim(0,3)
ax.xaxis.set_major_locator(plt.MultipleLocator(1.0))
ax.xaxis.set_minor_locator(plt.MultipleLocator(0.1))
ax.yaxis.set_major_locator(plt.MultipleLocator(1.0))
ax.yaxis.set_minor_locator(plt.MultipleLocator(0.1))
ax.grid(which='major', axis='x', linewidth=0.75, linestyle='-', color='0.75')
ax.grid(which='minor', axis='x', linewidth=0.25, linestyle='-', color='0.75')
ax.grid(which='major', axis='y', linewidth=0.75, linestyle='-', color='0.75')
ax.grid(which='minor', axis='y', linewidth=0.25, linestyle='-', color='0.75')
ax.set_xticklabels([])
ax.set_yticklabels([])

plt.show()
Total running time of the script: ( 0 minutes 0.016 seconds)