
Note
Click here to download the full example code
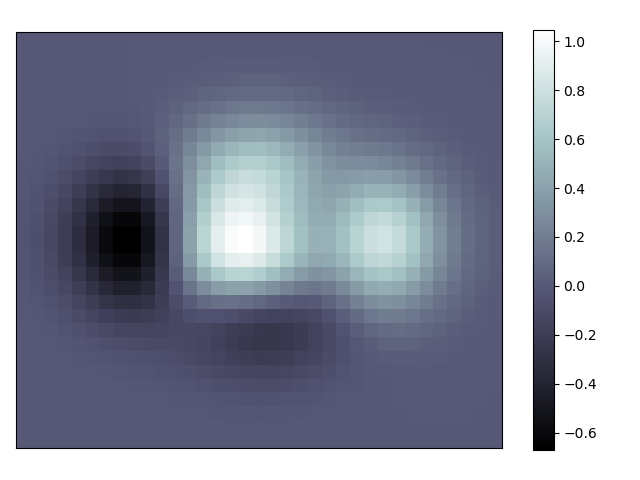
Imshow elaborate
An example demoing imshow and styling the figure.
import numpy as np
import matplotlib.pyplot as plt

def f(x, y):
    return (1 - x / 2 + x ** 5 + y ** 3 ) * np.exp(-x ** 2 - y ** 2)

n = 10
x = np.linspace(-3, 3, 3.5 * n)
y = np.linspace(-3, 3, 3.0 * n)
X, Y = np.meshgrid(x, y)
Z = f(X, Y)

plt.axes([0.025, 0.025, 0.95, 0.95])
plt.imshow(Z, interpolation='nearest', cmap='bone', origin='lower')
plt.colorbar(shrink=.92)

plt.xticks([])
plt.yticks([])
plt.show()
Total running time of the script: ( 0 minutes 0.033 seconds)