
Note
Click here to download the full example code
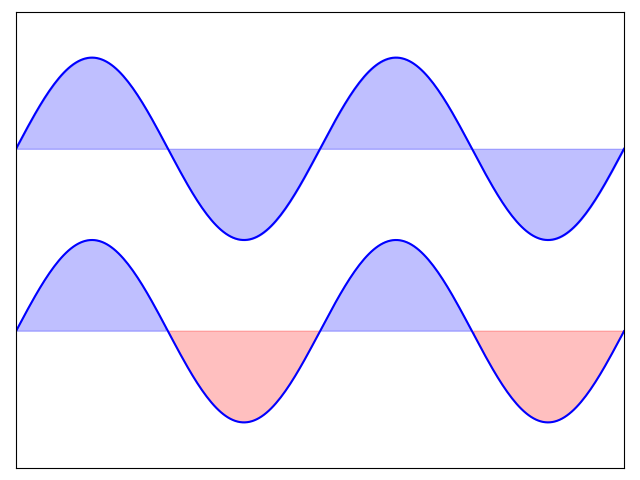
Plot and filled plots
Simple example of plots and filling between them with matplotlib.
import numpy as np
import matplotlib.pyplot as plt

n = 256
X = np.linspace(-np.pi, np.pi, n)
Y = np.sin(2 * X)

plt.axes([0.025, 0.025, 0.95, 0.95])

plt.plot(X, Y + 1, color='blue', alpha=1.00)
plt.fill_between(X, 1, Y + 1, color='blue', alpha=.25)

plt.plot(X, Y - 1, color='blue', alpha=1.00)
plt.fill_between(X, -1, Y - 1, (Y - 1) > -1, color='blue', alpha=.25)
plt.fill_between(X, -1, Y - 1, (Y - 1) < -1, color='red',  alpha=.25)

plt.xlim(-np.pi, np.pi)
plt.xticks([])
plt.ylim(-2.5, 2.5)
plt.yticks([])

plt.show()
Total running time of the script: ( 0 minutes 0.019 seconds)