
Note
Click here to download the full example code
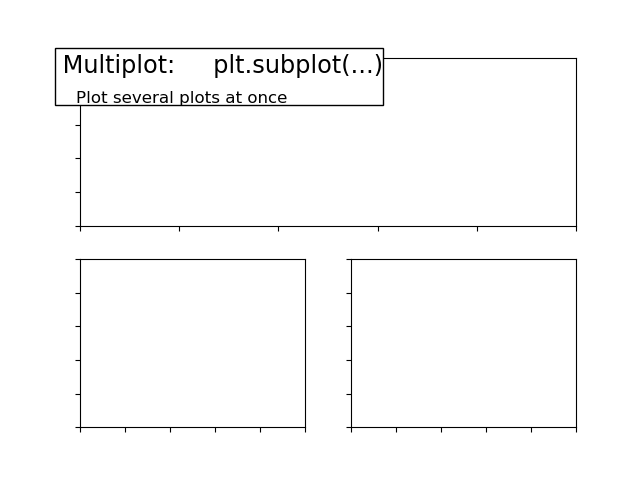
Multiple plots vignette
Demo multiple plots and style the figure.
import matplotlib.pyplot as plt

ax = plt.subplot(2, 1, 1)
ax.set_xticklabels([])
ax.set_yticklabels([])


# Add a title and a box around it
from matplotlib.patches import FancyBboxPatch
ax = plt.gca()
ax.add_patch(FancyBboxPatch((-0.05, .72),
                            width=.66, height=.34, clip_on=False,
                            boxstyle="square,pad=0", zorder=3,
                            facecolor='white', alpha=1.0,
                            transform=plt.gca().transAxes))

plt.text(-0.05, 1.02, " Multiplot:     plt.subplot(...)\n",
      horizontalalignment='left',
      verticalalignment='top',
      size='xx-large',
      transform=ax.transAxes)
plt.text(-0.05, 1.01, "\n\n    Plot several plots at once ",
      horizontalalignment='left',
      verticalalignment='top',
      size='large',
      transform=ax.transAxes)

ax = plt.subplot(2, 2, 3)
ax.set_xticklabels([])
ax.set_yticklabels([])

ax = plt.subplot(2, 2, 4)
ax.set_xticklabels([])
ax.set_yticklabels([])

plt.show()
Total running time of the script: ( 0 minutes 0.055 seconds)