
Note
Click here to download the full example code
1.6.12.13. Demo connected components
Extracting and labeling connected components in a 2D array
import numpy as np
from matplotlib import pyplot as plt
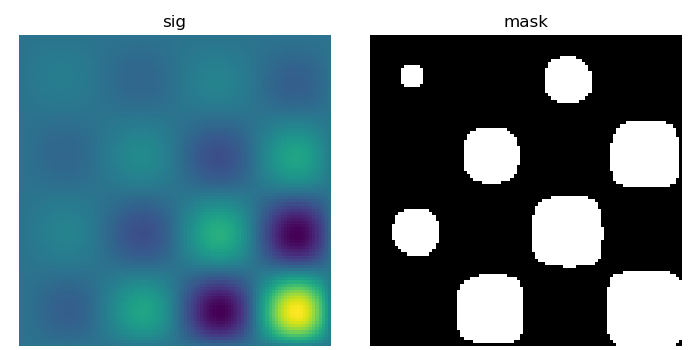
Generate some binary data
np.random.seed(0)
x, y = np.indices((100, 100))
sig = np.sin(2*np.pi*x/50.) * np.sin(2*np.pi*y/50.) * (1+x*y/50.**2)**2
mask = sig > 1

plt.figure(figsize=(7, 3.5))
plt.subplot(1, 2, 1)
plt.imshow(sig)
plt.axis('off')
plt.title('sig')

plt.subplot(1, 2, 2)
plt.imshow(mask, cmap=plt.cm.gray)
plt.axis('off')
plt.title('mask')
plt.subplots_adjust(wspace=.05, left=.01, bottom=.01, right=.99, top=.9)
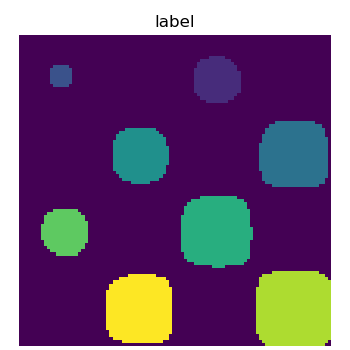
Label connected components
from scipy import ndimage
labels, nb = ndimage.label(mask)

plt.figure(figsize=(3.5, 3.5))
plt.imshow(labels)
plt.title('label')
plt.axis('off')

plt.subplots_adjust(wspace=.05, left=.01, bottom=.01, right=.99, top=.9)
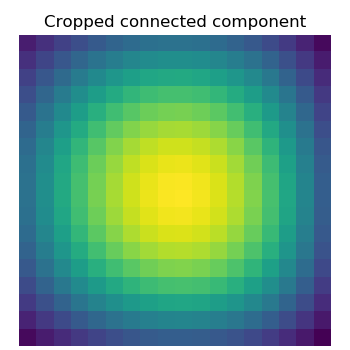
Extract the 4th connected component, and crop the array around it
sl = ndimage.find_objects(labels==4)
plt.figure(figsize=(3.5, 3.5))
plt.imshow(sig[sl[0]])
plt.title('Cropped connected component')
plt.axis('off')

plt.subplots_adjust(wspace=.05, left=.01, bottom=.01, right=.99, top=.9)

plt.show()
Total running time of the script: ( 0 minutes 0.047 seconds)