
Note
Click here to download the full example code
1.6.12.8. Curve fitting
Demos a simple curve fitting
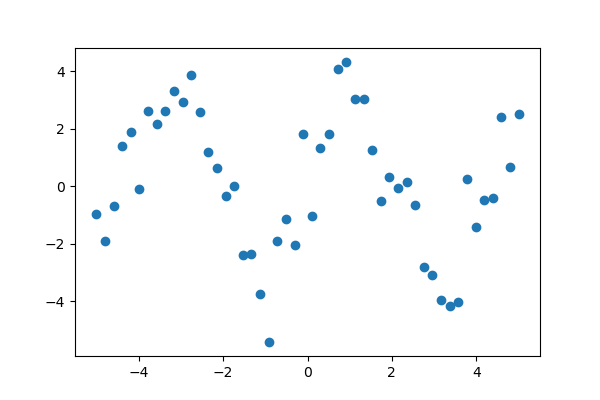
First generate some data
import numpy as np

# Seed the random number generator for reproducibility
np.random.seed(0)

x_data = np.linspace(-5, 5, num=50)
y_data = 2.9 * np.sin(1.5 * x_data) + np.random.normal(size=50)

# And plot it
import matplotlib.pyplot as plt
plt.figure(figsize=(6, 4))
plt.scatter(x_data, y_data)
Now fit a simple sine function to the data
from scipy import optimize

def test_func(x, a, b):
    return a * np.sin(b * x)

params, params_covariance = optimize.curve_fit(test_func, x_data, y_data,
                                               p0=[2, 2])

print(params)
Out:
[3.05931973 1.45754553]
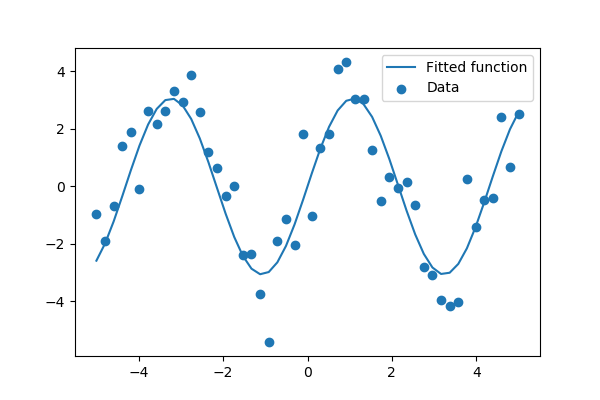
And plot the resulting curve on the data
plt.figure(figsize=(6, 4))
plt.scatter(x_data, y_data, label='Data')
plt.plot(x_data, test_func(x_data, params[0], params[1]),
         label='Fitted function')

plt.legend(loc='best')

plt.show()
Total running time of the script: ( 0 minutes 0.026 seconds)