
Note
Click here to download the full example code
The Gumbell distribution, results
Generate the exercise results on the Gumbell distribution
import numpy as np
import matplotlib.pyplot as plt
years_nb = 21
wspeeds = np.load('sprog-windspeeds.npy')
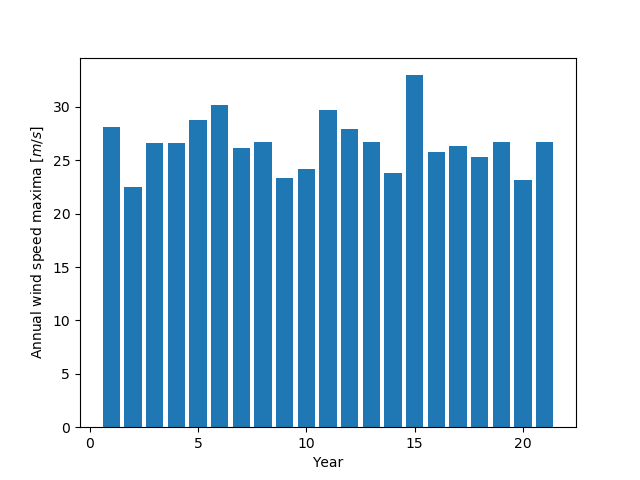
max_speeds = np.array([arr.max() for arr in np.array_split(wspeeds, years_nb)])
plt.figure()
plt.bar(np.arange(years_nb) + 1, max_speeds)
plt.axis('tight')
plt.xlabel('Year')
plt.ylabel('Annual wind speed maxima [$m/s$]')
Total running time of the script: ( 0 minutes 0.022 seconds)