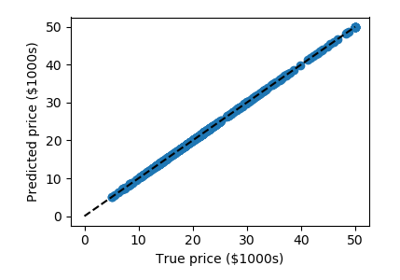
Measuring Decision Tree performance
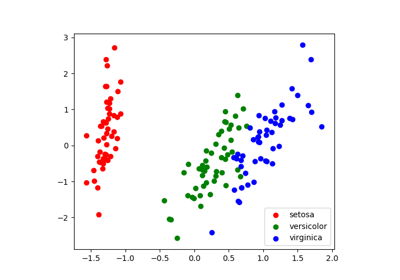
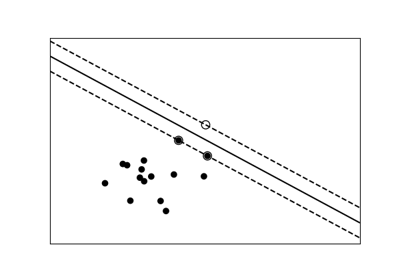
Demo PCA in 2D
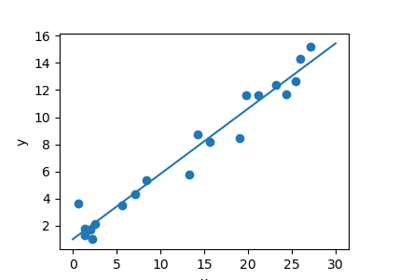
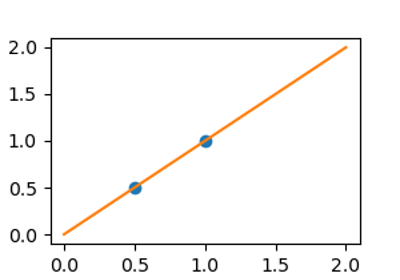
A simple linear regression
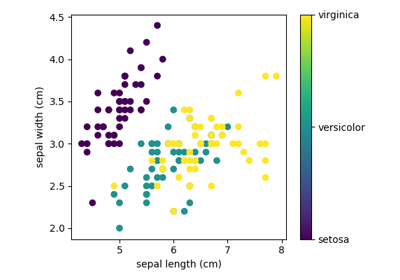
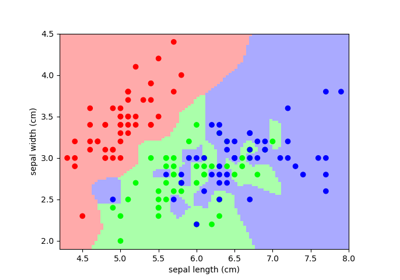
Plot 2D views of the iris dataset
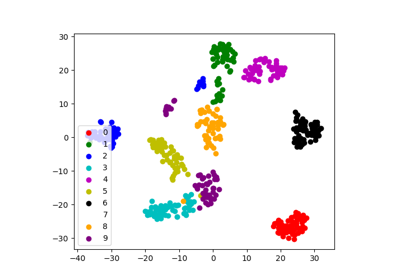
tSNE to visualize digits
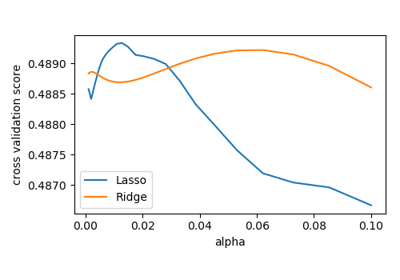
Use the RidgeCV and LassoCV to set the regularization parameter
Plot variance and regularization in linear models
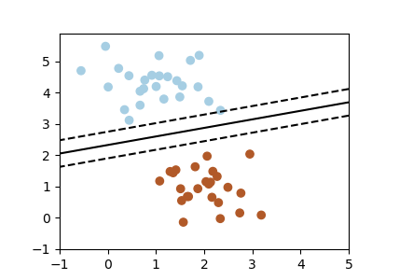
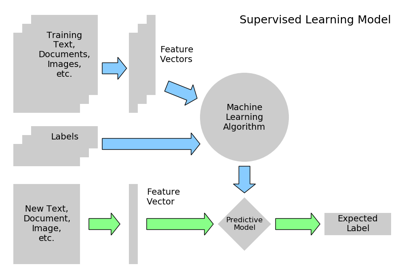
Simple picture of the formal problem of machine learning
Compare classifiers on the digits data
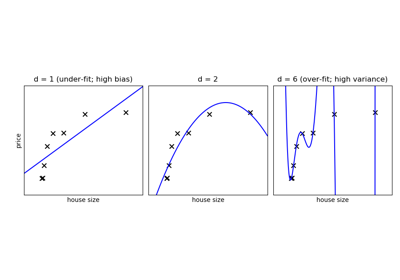
Plot fitting a 9th order polynomial
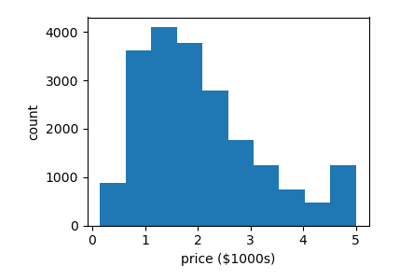
A simple regression analysis on the California housing data
Nearest-neighbor prediction on iris
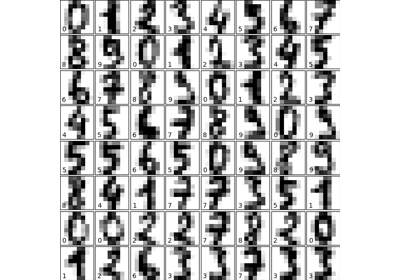
Simple visualization and classification of the digits dataset
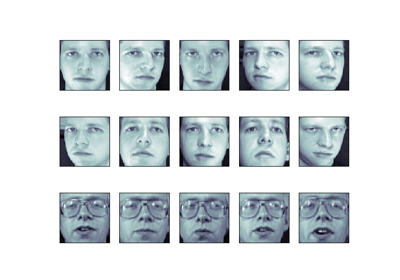
The eigenfaces example: chaining PCA and SVMs
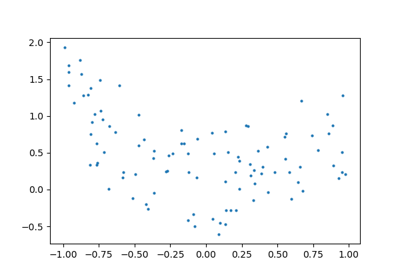
Example of linear and non-linear models
Bias and variance of polynomial fit
Tutorial Diagrams
Gallery generated by Sphinx-Gallery