
Note
Click here to download the full example code
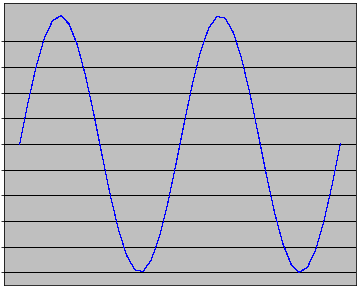
A example of plotting not quite right
An “ugly” example of plotting.
import numpy as np
import matplotlib
matplotlib.use('Agg')
import matplotlib.pyplot as plt

matplotlib.rc('grid', color='black', linestyle='-', linewidth=1)

fig = plt.figure(figsize=(5,4),dpi=72)
axes = fig.add_axes([0.01, 0.01, .98, 0.98], facecolor='.75')
X = np.linspace(0, 2, 40)
Y = np.sin(2 * np.pi * X)
plt.plot(X, Y, lw=.05, c='b', antialiased=False)

plt.xticks([])
plt.yticks(np.arange(-1., 1., 0.2))
plt.grid()
ax = plt.gca()

plt.show()
Total running time of the script: ( 0 minutes 0.020 seconds)