Note
Click here to download the full example code
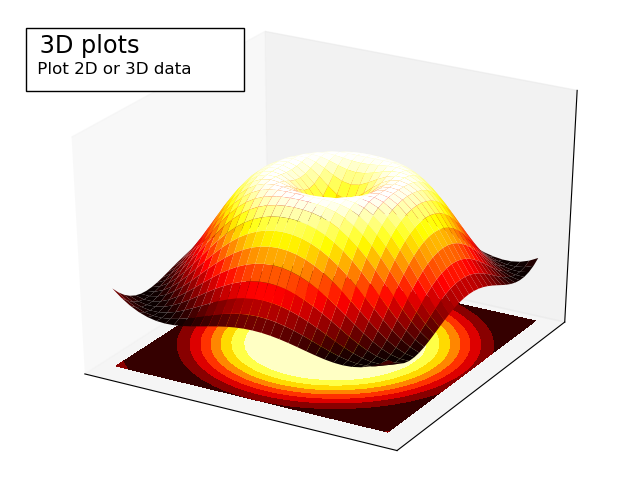
3D plotting vignette
Demo 3D plotting with matplotlib and decorate the figure.

import numpy as np
import matplotlib.pyplot as plt
from mpl_toolkits.mplot3d import Axes3D

fig = plt.figure()
ax = Axes3D(fig)
X = np.arange(-4, 4, 0.25)
Y = np.arange(-4, 4, 0.25)
X, Y = np.meshgrid(X, Y)
R = np.sqrt(X ** 2 + Y ** 2)
Z = np.sin(R)

ax.plot_surface(X, Y, Z, rstride=1, cstride=1, cmap=plt.cm.hot)
ax.contourf(X, Y, Z, zdir='z', offset=-2, cmap=plt.cm.hot)
ax.set_zlim(-2, 2)
plt.xticks([])
plt.yticks([])
ax.set_zticks([])

ax.text2D(0.05, .93, " 3D plots             \n",
          horizontalalignment='left',
          verticalalignment='top',
          size='xx-large',
          bbox=dict(facecolor='white', alpha=1.0),
          transform=plt.gca().transAxes)

ax.text2D(0.05, .87, " Plot 2D or 3D data",
          horizontalalignment='left',
          verticalalignment='top',
          size='large',
          transform=plt.gca().transAxes)

plt.show()
Total running time of the script: ( 0 minutes 0.062 seconds)
