
Note
Click here to download the full example code
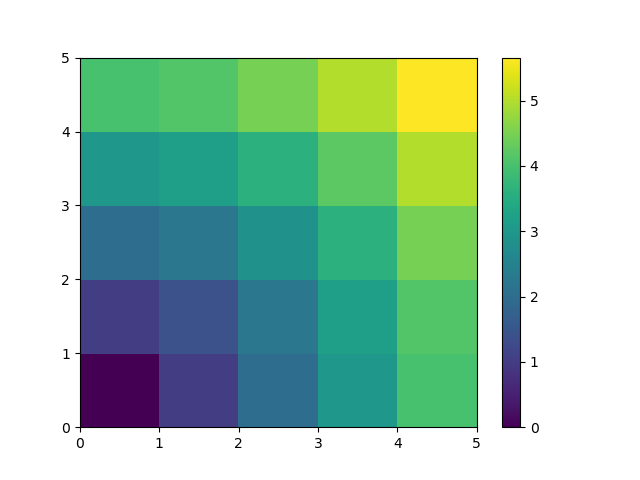
Distances exercise
Plot distances in a grid
import numpy as np
import matplotlib.pyplot as plt

x, y = np.arange(5), np.arange(5)[:, np.newaxis]
distance = np.sqrt(x ** 2 + y ** 2)
plt.pcolor(distance)
plt.colorbar()
plt.show()
Total running time of the script: ( 0 minutes 0.084 seconds)