
Note
Click here to download the full example code
1.6.12.9. Spectrogram, power spectral density
Demo spectrogram and power spectral density on a frequency chirp.
import numpy as np
from matplotlib import pyplot as plt
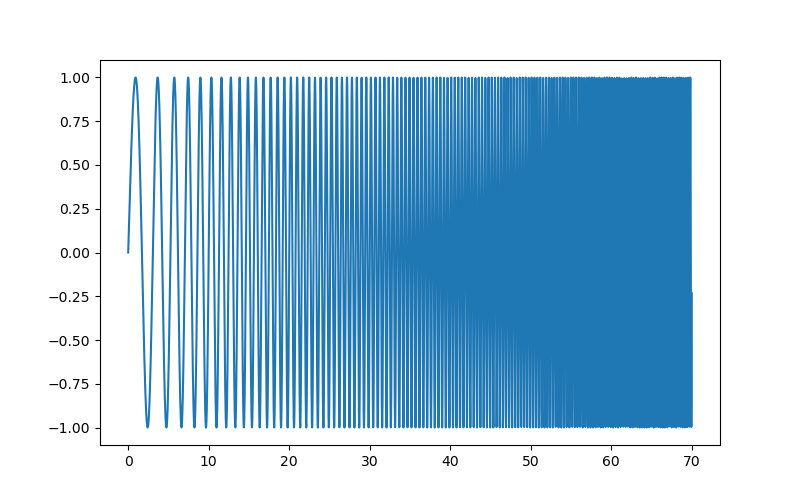
Generate a chirp signal
# Seed the random number generator
np.random.seed(0)

time_step = .01
time_vec = np.arange(0, 70, time_step)

# A signal with a small frequency chirp
sig = np.sin(0.5 * np.pi * time_vec * (1 + .1 * time_vec))

plt.figure(figsize=(8, 5))
plt.plot(time_vec, sig)
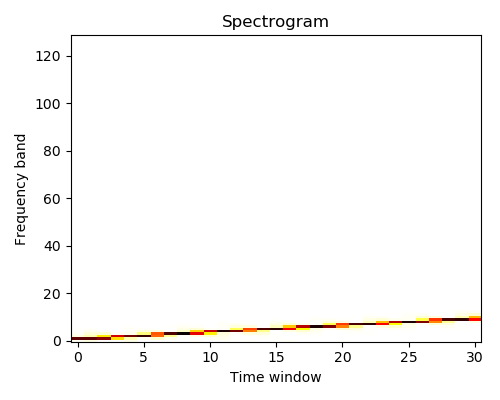
Compute and plot the spectrogram
The spectrum of the signal on consecutive time windows
from scipy import signal
freqs, times, spectrogram = signal.spectrogram(sig)

plt.figure(figsize=(5, 4))
plt.imshow(spectrogram, aspect='auto', cmap='hot_r', origin='lower')
plt.title('Spectrogram')
plt.ylabel('Frequency band')
plt.xlabel('Time window')
plt.tight_layout()
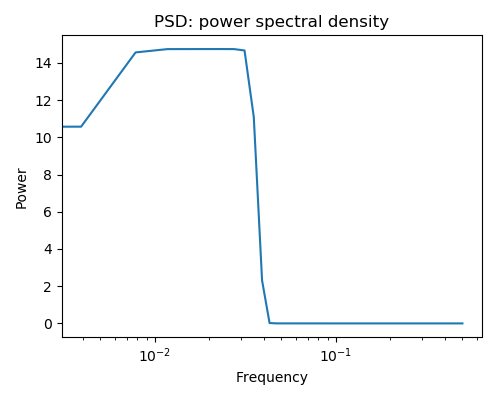
Compute and plot the power spectral density (PSD)
The power of the signal per frequency band
freqs, psd = signal.welch(sig)

plt.figure(figsize=(5, 4))
plt.semilogx(freqs, psd)
plt.title('PSD: power spectral density')
plt.xlabel('Frequency')
plt.ylabel('Power')
plt.tight_layout()
plt.show()
Total running time of the script: ( 0 minutes 0.200 seconds)