
Note
Click here to download the full example code
The Gumbell distribution
Generate the exercise results on the Gumbell distribution
import numpy as np
from scipy.interpolate import UnivariateSpline
import matplotlib.pyplot as plt
def gumbell_dist(arr):
return -np.log(-np.log(arr))
years_nb = 21
wspeeds = np.load('sprog-windspeeds.npy')
max_speeds = np.array([arr.max() for arr in np.array_split(wspeeds, years_nb)])
sorted_max_speeds = np.sort(max_speeds)
cprob = (np.arange(years_nb, dtype=np.float32) + 1)/(years_nb + 1)
gprob = gumbell_dist(cprob)
speed_spline = UnivariateSpline(gprob, sorted_max_speeds, k=1)
nprob = gumbell_dist(np.linspace(1e-3, 1-1e-3, 1e2))
fitted_max_speeds = speed_spline(nprob)
fifty_prob = gumbell_dist(49./50.)
fifty_wind = speed_spline(fifty_prob)
plt.figure()
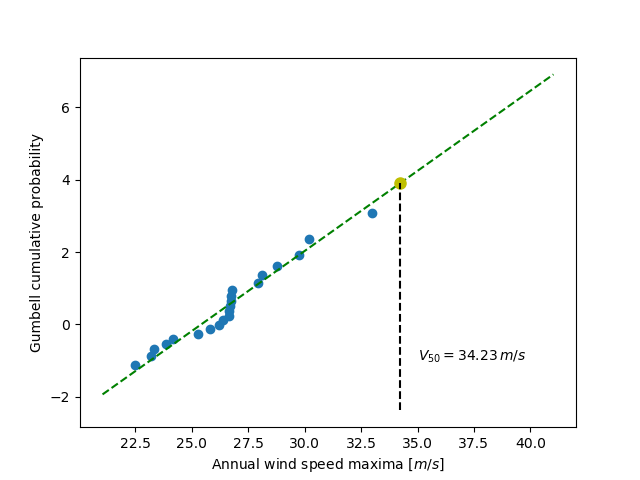
plt.plot(sorted_max_speeds, gprob, 'o')
plt.plot(fitted_max_speeds, nprob, 'g--')
plt.plot([fifty_wind], [fifty_prob], 'o', ms=8., mfc='y', mec='y')
plt.plot([fifty_wind, fifty_wind], [plt.axis()[2], fifty_prob], 'k--')
plt.text(35, -1, r'$V_{50} = %.2f \, m/s$' % fifty_wind)
plt.xlabel('Annual wind speed maxima [$m/s$]')
plt.ylabel('Gumbell cumulative probability')
plt.show()
Total running time of the script: ( 0 minutes 0.015 seconds)