
1.6.11.3. Image processing application: counting bubbles and unmolten grains
Statement of the problem
Open the image file MV_HFV_012.jpg and display it. Browse through the keyword arguments in the docstring of
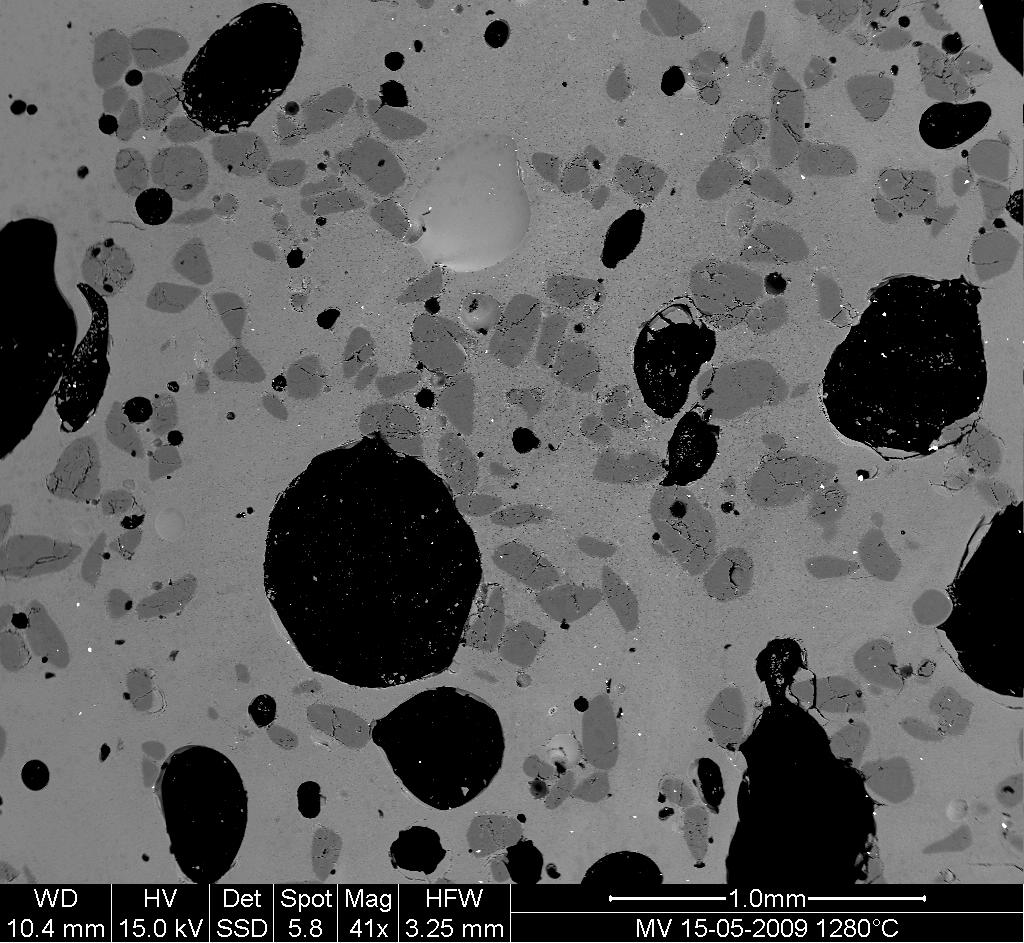
imshowto display the image with the “right” orientation (origin in the bottom left corner, and not the upper left corner as for standard arrays).This Scanning Element Microscopy image shows a glass sample (light gray matrix) with some bubbles (on black) and unmolten sand grains (dark gray). We wish to determine the fraction of the sample covered by these three phases, and to estimate the typical size of sand grains and bubbles, their sizes, etc.
Crop the image to remove the lower panel with measure information.
Slightly filter the image with a median filter in order to refine its histogram. Check how the histogram changes.
Using the histogram of the filtered image, determine thresholds that allow to define masks for sand pixels, glass pixels and bubble pixels. Other option (homework): write a function that determines automatically the thresholds from the minima of the histogram.
Display an image in which the three phases are colored with three different colors.
Use mathematical morphology to clean the different phases.
Attribute labels to all bubbles and sand grains, and remove from the sand mask grains that are smaller than 10 pixels. To do so, use
ndimage.sumornp.bincountto compute the grain sizes.Compute the mean size of bubbles.