Note
Click here to download the full example code
3.6.10.5. tSNE to visualize digits
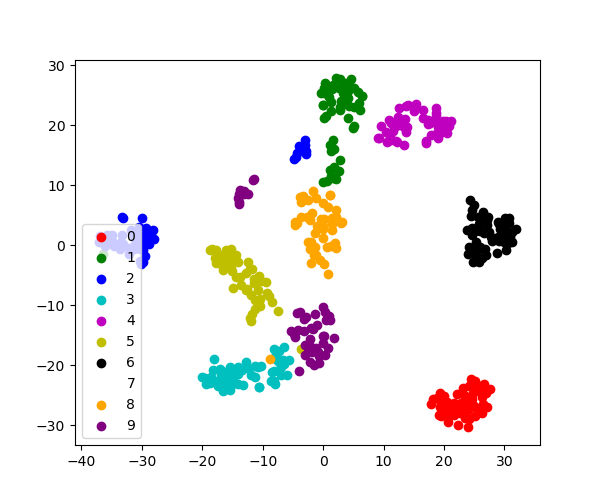
Here we use sklearn.manifold.TSNE to visualize the digits
datasets. Indeed, the digits are vectors in a 8*8 = 64 dimensional space.
We want to project them in 2D for visualization. tSNE is often a good
solution, as it groups and separates data points based on their local
relationship.
Load the iris data
from sklearn import datasets
digits = datasets.load_digits()
# Take the first 500 data points: it's hard to see 1500 points
X = digits.data[:500]
y = digits.target[:500]
Fit and transform with a TSNE
Project the data in 2D
X_2d = tsne.fit_transform(X)
Visualize the data
target_ids = range(len(digits.target_names))

from matplotlib import pyplot as plt
plt.figure(figsize=(6, 5))
colors = 'r', 'g', 'b', 'c', 'm', 'y', 'k', 'w', 'orange', 'purple'
for i, c, label in zip(target_ids, colors, digits.target_names):
    plt.scatter(X_2d[y == i, 0], X_2d[y == i, 1], c=c, label=label)
plt.legend()
plt.show()

Total running time of the script: ( 0 minutes 1.335 seconds)
