
Note
Click here to download the full example code
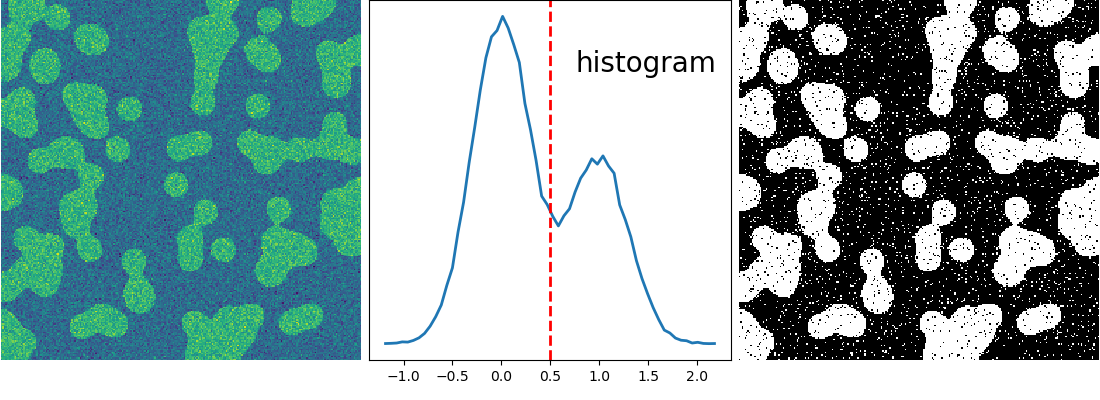
2.6.8.21. Segmentation with Gaussian mixture models
This example performs a Gaussian mixture model analysis of the image histogram to find the right thresholds for separating foreground from background.
import numpy as np
from scipy import ndimage
import matplotlib.pyplot as plt
from sklearn.mixture import GaussianMixture

np.random.seed(1)
n = 10
l = 256
im = np.zeros((l, l))
points = l*np.random.random((2, n**2))
im[(points[0]).astype(np.int), (points[1]).astype(np.int)] = 1
im = ndimage.gaussian_filter(im, sigma=l/(4.*n))

mask = (im > im.mean()).astype(np.float)


img = mask + 0.3*np.random.randn(*mask.shape)

hist, bin_edges = np.histogram(img, bins=60)
bin_centers = 0.5*(bin_edges[:-1] + bin_edges[1:])

classif = GaussianMixture(n_components=2)
classif.fit(img.reshape((img.size, 1)))

threshold = np.mean(classif.means_)
binary_img = img > threshold


plt.figure(figsize=(11,4))

plt.subplot(131)
plt.imshow(img)
plt.axis('off')
plt.subplot(132)
plt.plot(bin_centers, hist, lw=2)
plt.axvline(0.5, color='r', ls='--', lw=2)
plt.text(0.57, 0.8, 'histogram', fontsize=20, transform = plt.gca().transAxes)
plt.yticks([])
plt.subplot(133)
plt.imshow(binary_img, cmap=plt.cm.gray, interpolation='nearest')
plt.axis('off')

plt.subplots_adjust(wspace=0.02, hspace=0.3, top=1, bottom=0.1, left=0, right=1)
plt.show()
Total running time of the script: ( 0 minutes 0.248 seconds)