
Note
Click here to download the full example code
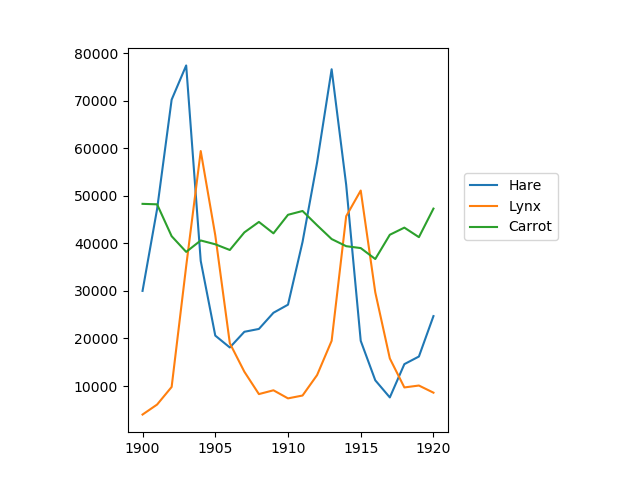
Population exercise
Plot populations of hares, lynxes, and carrots
import numpy as np
import matplotlib.pyplot as plt

data = np.loadtxt('../../../data/populations.txt')
year, hares, lynxes, carrots = data.T

plt.axes([0.2, 0.1, 0.5, 0.8])
plt.plot(year, hares, year, lynxes, year, carrots)
plt.legend(('Hare', 'Lynx', 'Carrot'), loc=(1.05, 0.5))
plt.show()
Total running time of the script: ( 0 minutes 0.016 seconds)