
Note
Click here to download the full example code
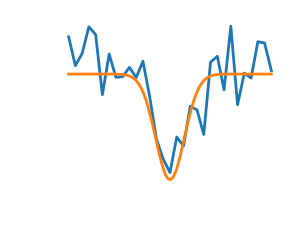
2.7.4.1. Noisy optimization problem
Draws a figure explaining noisy vs non-noisy optimization
import numpy as np
import matplotlib.pyplot as plt

np.random.seed(0)

x = np.linspace(-5, 5, 101)
x_ = np.linspace(-5, 5, 31)

def f(x):
    return -np.exp(-x**2)

# A smooth function
plt.figure(1, figsize=(3, 2.5))
plt.clf()

plt.plot(x_, f(x_) + .2*np.random.normal(size=31), linewidth=2)
plt.plot(x, f(x), linewidth=2)

plt.ylim(ymin=-1.3)
plt.axis('off')
plt.tight_layout()
plt.show()
Total running time of the script: ( 0 minutes 0.040 seconds)